Are you struggling to make sense of complex data?
Imagine having the power to transform intricate datasets into actionable insights with just a glance.
Unlock the potential hidden within your data and make informed decisions that drive your business forward.
Introducing the world of data visualization—a game-changing tool that empowers you to understand and extract valuable information from your data effortlessly.
Join us as we explore the fascinating realm of data visualization, learn about the best data visualization tools and techniques, and discover how they can revolutionize your decision-making processes.
Get ready to embark on a journey where complex data becomes a catalyst for growth and success.
What Is Data Visualization?
Imagine you have a massive pile of data sitting in front of you. It’s like trying to decipher a complex puzzle without any clues. How can you make sense of it all? Well, that’s where data visualization comes to the rescue!
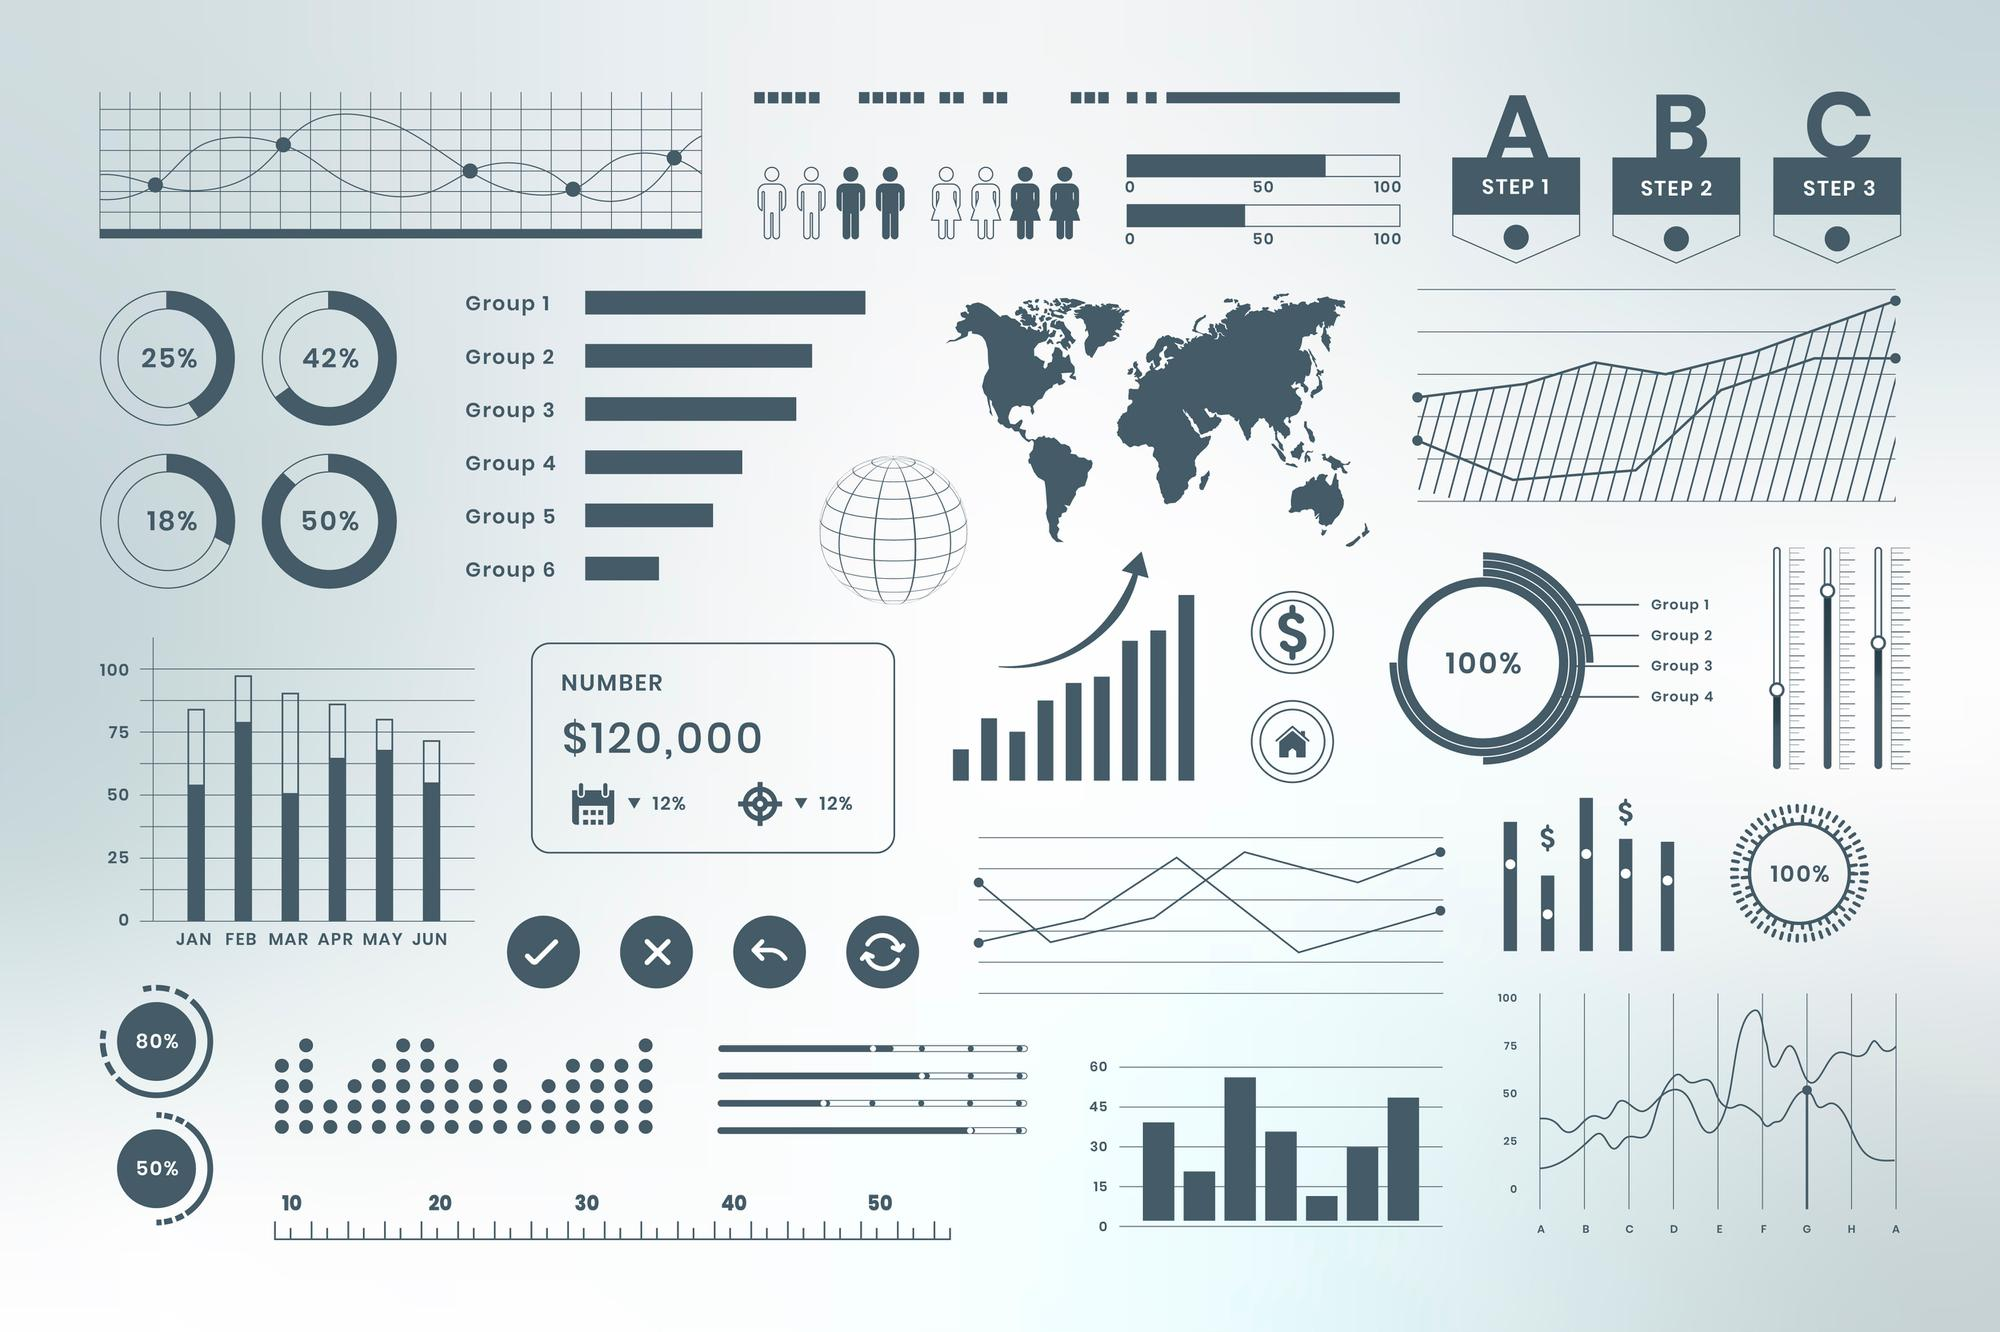
Data visualization is like the superhero that transforms boring, overwhelming numbers into captivating visual stories. It’s the art of representing data in charts, graphs, and other visual forms that are easy to understand at a glance.
Think about it this way: instead of staring at endless rows and columns of numbers, data visualization transforms that information into colorful charts and graphs that paint a clear picture of what’s going on. It’s like putting on a pair of glasses that make everything crystal clear.
Whether you’re a business analyst, a scientist, or just a curious individual, data visualization is your ticket to unlocking the power of data. It helps you make informed decisions, tell compelling stories, and communicate your findings in a way that everyone can understand.

Why Does Data Visualization Matter?
Data visualization matters because it takes boring, complicated data and turns it into a visual feast for your eyes. It’s like having a magical translator that transforms numbers and statistics into colorful charts, graphs, and maps that anyone can understand.
Let’s break it down:

Easy-peasy comprehension
Humans are visual creatures. We process images faster than text, and data visualization taps into this innate ability. By presenting information visually, it becomes much easier to comprehend complex concepts and spot patterns or trends. It’s like having a superpower that lets you absorb information at lightning speed.
Lightbulb moments
Have you ever struggled to explain an idea or concept to someone? Data visualization comes to the rescue by simplifying complex information. With clear and concise visuals, you can effortlessly communicate your findings and insights to others. It’s like turning on a lightbulb in their minds, helping them understand and make sense of the data.
Spotting hidden treasures
Data hides valuable insights like buried treasure waiting to be discovered. Data visualization helps you dig deep and uncover these hidden gems.
By visualizing data, you can spot trends, outliers, and correlations that might have remained hidden in a sea of numbers. It’s like having X-ray vision for your data, revealing patterns and connections that can lead to game-changing discoveries.

Decision-making superpowers
In a world driven by data, making informed decisions is crucial. Data visualization equips you with superpowers to make smarter choices. By presenting data visually with visualization tools, you can quickly grasp the big picture and identify opportunities or areas that need improvement. It’s like having a crystal ball that guides you toward data-driven decision-making.
Engaging storytelling
Numbers alone might not captivate an audience, but data visualization can transform your data into compelling stories. Visuals bring your data to life, making it relatable and memorable. Whether you’re presenting to colleagues, stakeholders, or clients, data visualization helps you weave a narrative that captivates and inspires action.
So, the next time you’re faced with a mountain of data, don’t feel overwhelmed. Embrace the power of data visualization and watch as it transforms your understanding, communication, and decision-making.
It’s like having a trusty sidekick that helps you navigate the complex world of data with ease. Get ready to visualize your way to insights and unleash the superhero within you!
Types of Visualizations and their Applications
There is a wide array of visualizations type to choose from. Let’s explore some of the most common ones and their applications:

Pie Charts: First data visualization tool for graphical representation
Perfect for showing proportions or percentages. Imagine representing a sales report with slices of a pie, each slice indicating the percentage of sales contributed by a particular product.
Bar Charts
Great for comparing different categories or groups. For example, you can use a bar chart to showcase the sales performance of multiple products over a specific period.
Line Charts
Ideal for visualizing trends and changes over time. Use a line chart to track stock prices or monitor website traffic growth.
Interactive Charts and Visualizations
Interactive charts take data visualization to the next level by allowing users to interact with the visualizations. These can include tooltips, drill-down functionality, or filters that allow users to explore the data further.
For instance, an interactive chart can allow users to click on different data points to see detailed information or filter the data based on specific criteria.
Scatter Plots
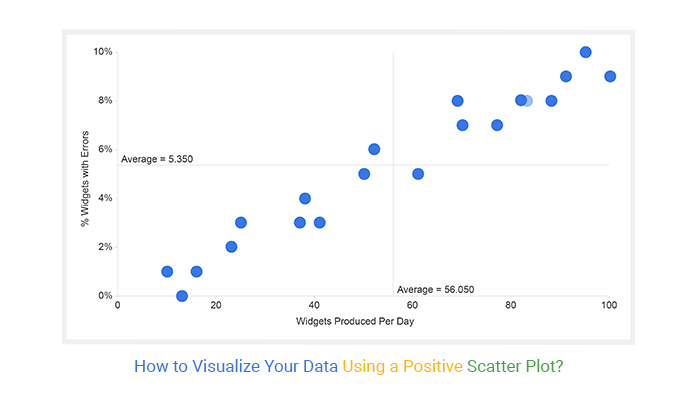
These are used to display the relationship between two variables. They are great for identifying correlations or clusters within the data. For example, you can create a scatter plot to analyze the relationship between a product’s price and its sales volume.
Area Charts
Ideal for illustrating trends and changes over time while also showcasing the magnitude of a variable. Use an area chart to display how a company’s revenue from different product lines has changed over several years.
Line Graphs
Similar to area charts, line graphs visualize trends over time. They are especially useful when you want to track multiple variables simultaneously. For instance, you can create a line graph to compare the monthly revenue of different branches of a retail chain.
Bubble Charts
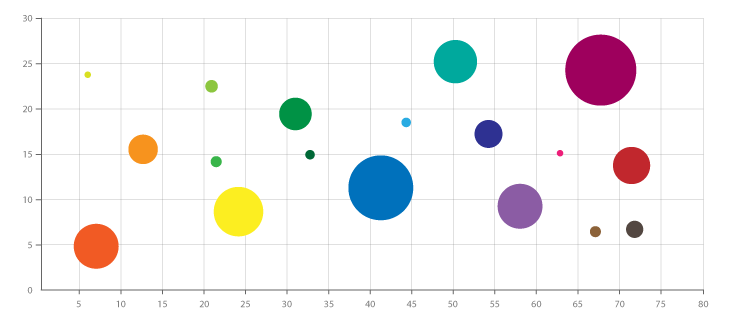
These charts allow you to represent three variables at once using the position, size, and color of bubbles. Bubble charts are perfect for visualizing complex relationships or comparing multiple dimensions.
For example, you can use a bubble chart to display the population, GDP, and life expectancy of different countries.
Choropleth Maps
These maps use color shading or patterns to represent data across geographic regions. They are excellent for visualizing spatial patterns or comparing data across different locations. For example, you can use a choropleth map to showcase population density across various states.
Heat Maps
Heat maps use color intensity to represent data values, usually over a grid or matrix. They are effective for visualizing patterns, concentrations, or densities of data. Heat maps are commonly used in fields such as finance, biology, and website analytics to represent data like stock prices, gene expression, or user behavior.
Network Graphs
These visualizations illustrate relationships or connections between entities. Network graphs consist of nodes (representing entities) and edges (representing connections). They are widely used in social network analysis, transportation networks, and supply chain management, among others. Network graphs can show the connections between people in a social media network or the relationships between airports in an airline network.
Data Visualization Techniques
To create impactful data visualizations, it’s essential to employ certain techniques that maximize clarity and understanding. Let’s explore some key techniques for effective data visualization:

Choosing the Right Visualization Method for Different Data Types
Not all data is created equal, and different types of data require different visualization techniques. Understanding the nature of your data is crucial in selecting the most appropriate visualization method.
For example, categorical data can be effectively represented using bar charts or pie charts, while time series data may lend itself well to line charts or area charts. Consider the characteristics of your data and choose the visualization method that best showcases its unique features.
Identifying Patterns and Trends in Data
Data visualization is not just about creating pretty pictures; it’s about extracting insights and discovering meaningful patterns. Take the time to explore your data visually and look for trends, correlations, or outliers. By visually examining your data, you can uncover patterns that might be difficult to detect through raw numbers alone. These patterns can provide valuable insights and guide decision-making processes.
Visual Storytelling and Creating Insightful Reports
Data visualization is not just about presenting numbers; it’s about telling a story with your data. Think about the narrative you want to convey and how you can structure your visualizations to support that story. Consider the intended audience and create visualizations that speak directly to them.
Use clear titles, labels, and annotations to guide your audience through the story your data tells. By incorporating visual storytelling techniques, you can make your data more engaging and memorable.

Best Practices in Data Visualization
When it comes to data visualization, following best practices ensures that your visualizations are effective, clear, and impactful. Here are some key best practices to keep in mind:
Keep it Simple and Clear
Simplify your visualizations by removing unnecessary elements and focusing on the core message. Avoid clutter and distractions that can hinder understanding. Use clear and concise labels, titles, and legends to guide the audience and ensure they grasp the main points easily.
Choose Appropriate Visualizations
Select the right visualization method that best represents your data and supports your message. Consider the characteristics of your data, such as its type, distribution, and relationships, when choosing between bar charts, line charts, scatter plots, or other visualization types. Match the visualization to the data to ensure clarity and accuracy.
Use Colors Purposefully
Colors can enhance visual appeal and highlight important information. However, it’s important to use colors purposefully and meaningfully. Choose a color palette that is accessible and easily distinguishable for all viewers. Consider colorblindness and ensure that color choices do not hinder understanding.
Use color sparingly to avoid overwhelming the audience.
Provide Context and Interpretation
Help your audience understand the significance of your visualizations by providing context and interpretation. Add titles, captions, or annotations to explain the key takeaways or insights.
Offer explanations of the data sources, methodologies, and any limitations or assumptions made during the analysis. Contextualize the data to make it relevant and meaningful to your audience.
Use Consistent and Intuitive Layouts
Maintain consistency in your visualizations to facilitate comprehension. Use consistent labeling, font sizes, and scales across multiple charts or graphs to ensure a seamless viewing experience. Arrange the elements in an intuitive and logical manner to guide the audience’s attention and flow of information.
Test and Iterate
Continuously test and iterate your visualizations to refine and improve their effectiveness. Seek feedback from users or colleagues to identify areas for improvement. Experiment with different design elements, layouts, or color schemes to find the most impactful presentation. Iterate based on feedback and iterate again until you achieve the desired clarity and impact.
Remember, the goal of data visualization is to communicate information effectively and make data-driven insights accessible. By adhering to these best practices, you can create visualizations that engage your audience, facilitate understanding, and drive informed decision-making.
Data Visualization Process
To effectively visualize data, a well-defined process is followed.

Data sources and data manipulation
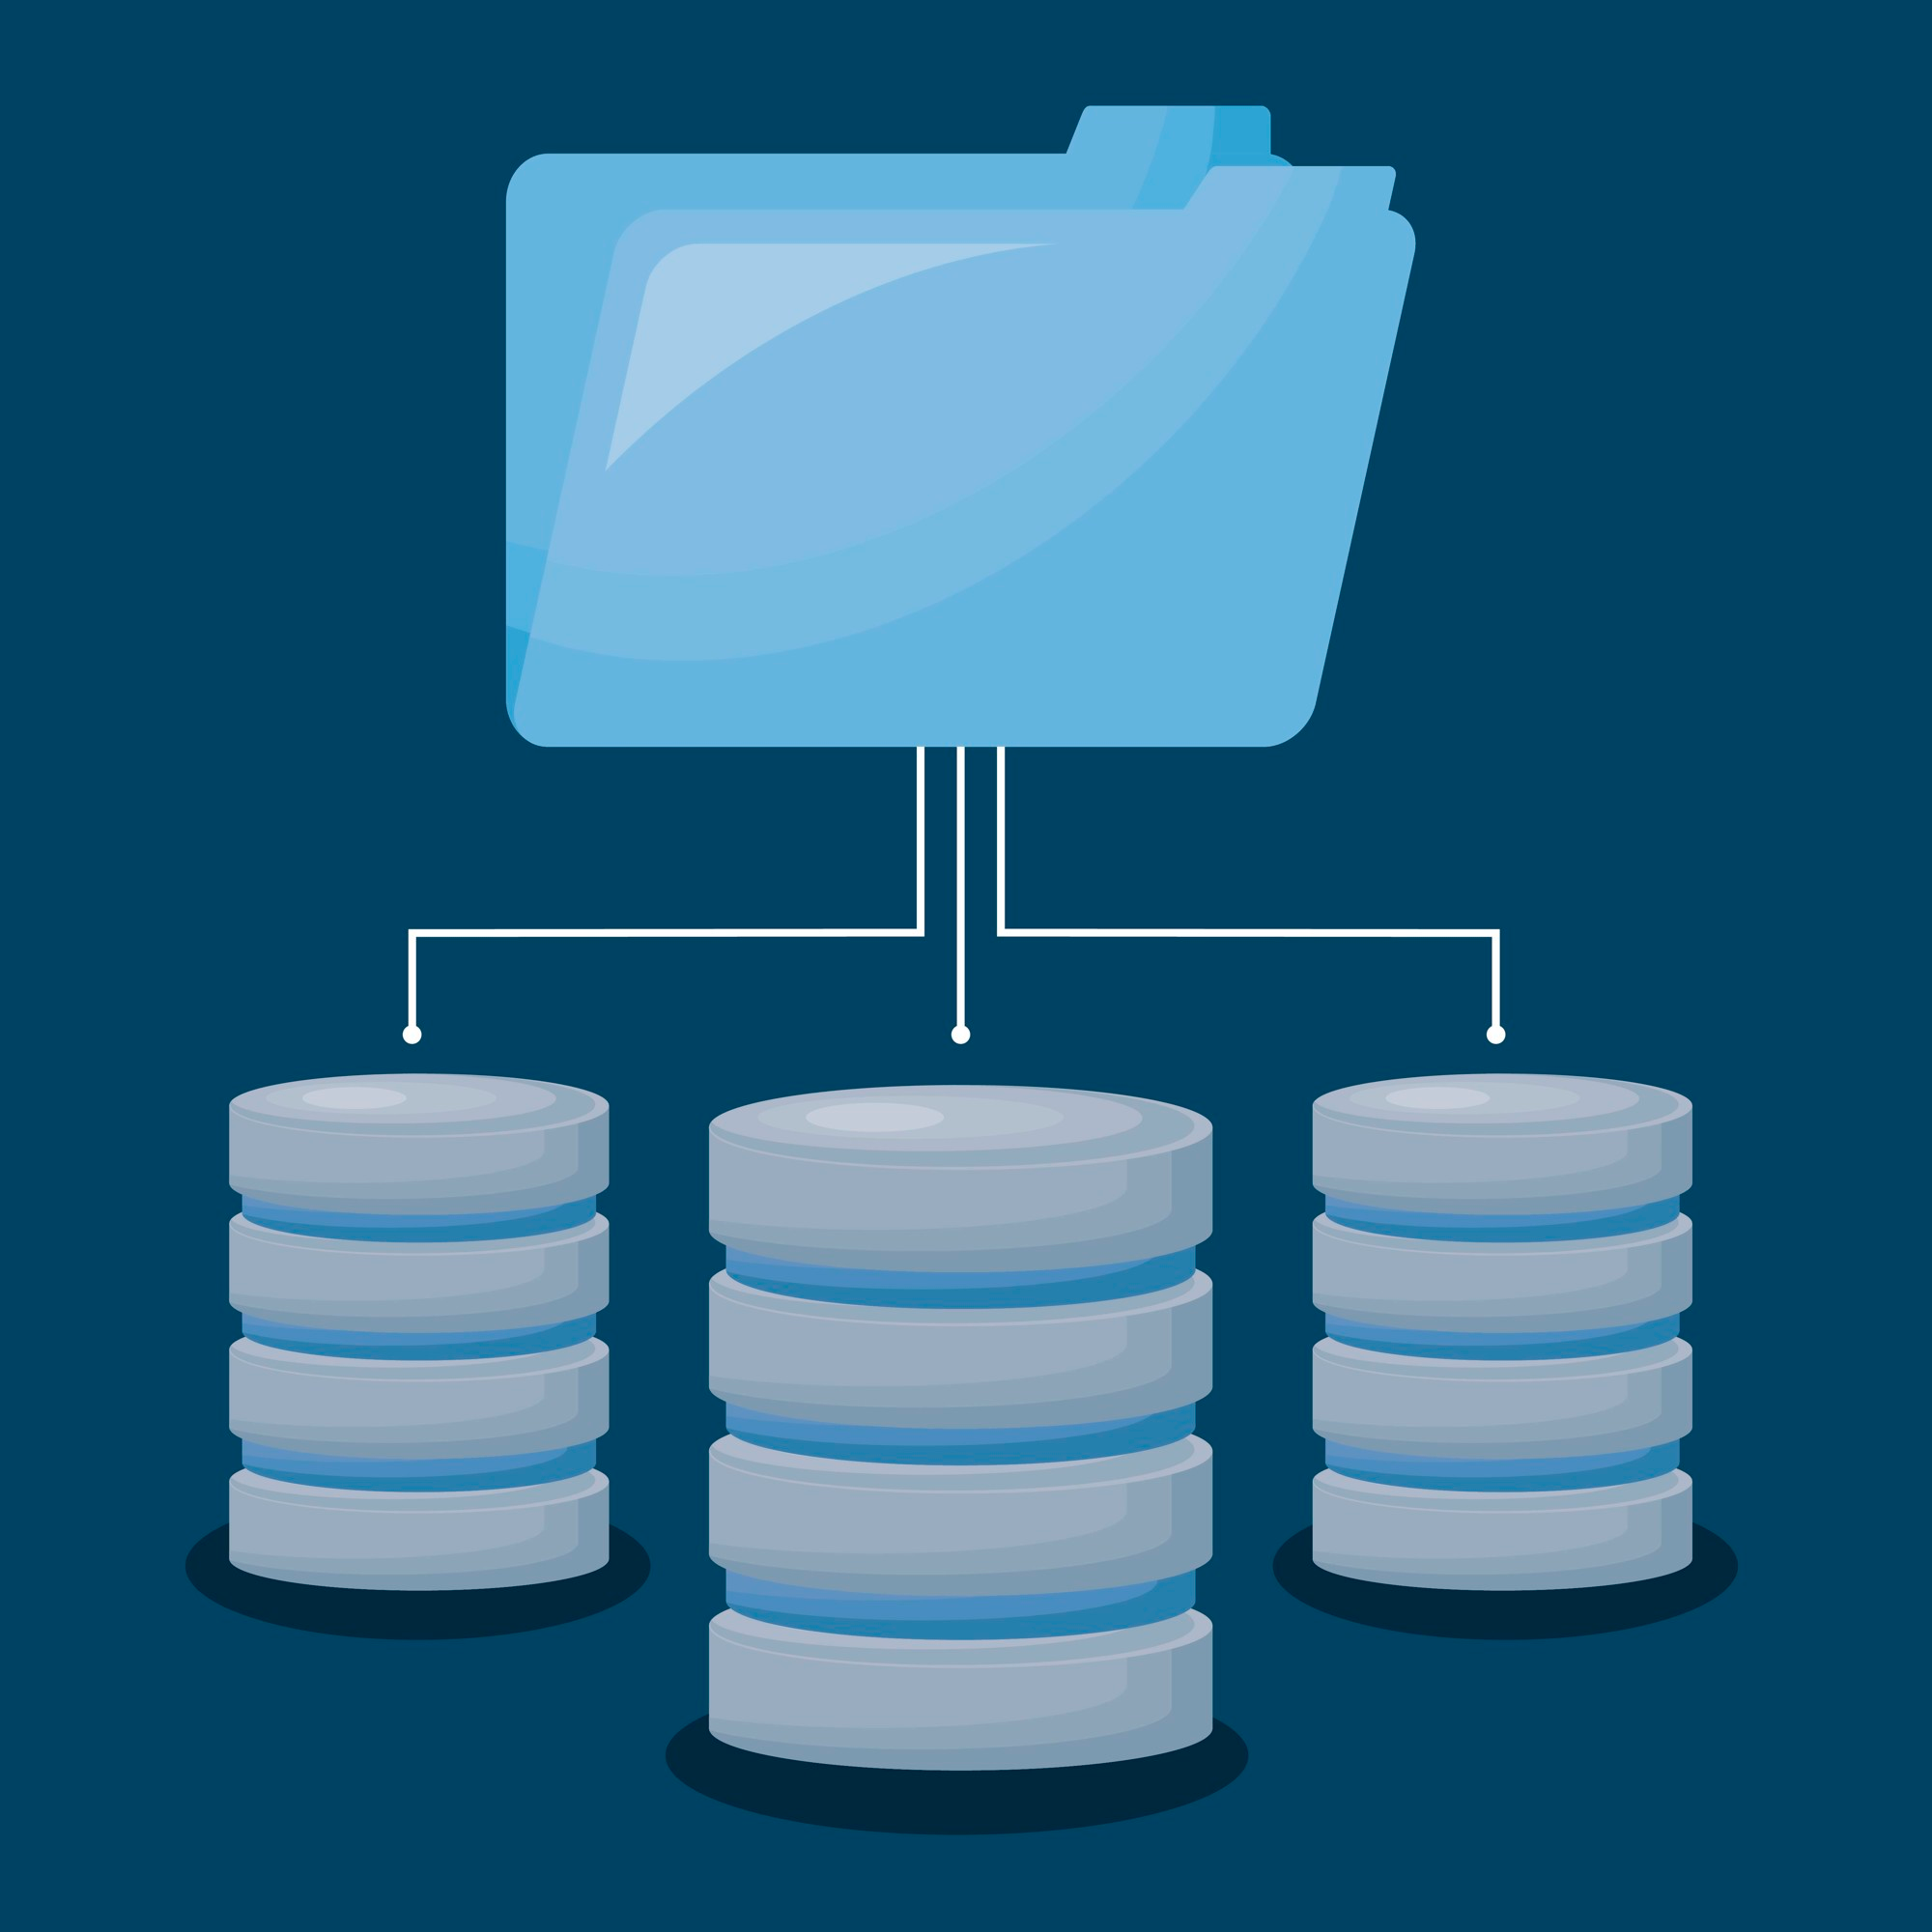
The first step is to identify and gather relevant and different data sources. This may involve importing data from databases, spreadsheets, or external APIs.
Once the data is collected, it goes through a process of cleansing and formatting, ensuring consistency and accuracy.
Removing duplicates, correcting errors, and transforming data into a usable format is part of this data manipulation phase.
Creating visual representations
Data visualization tools provide a user-friendly interface to create visual representations of the data.
Utilizing data visualization tools, users can choose appropriate visualization types, customize their appearance, and add interactive elements. The drag-and-drop editors offered by many tools simplify the process, allowing users to create visualizations without writing complex code.
Presenting and interpreting data
Visualizations are not just about creating visually appealing charts; they are meant to communicate information effectively. Displaying data in a clear and understandable manner is essential for different audiences.
Visualizations enable users to interpret the data and extract practical insights. By analyzing the graphic representations, patterns, trends, and relationships within the data can be identified, leading to informed decision-making.
Best Data Visualization Tools
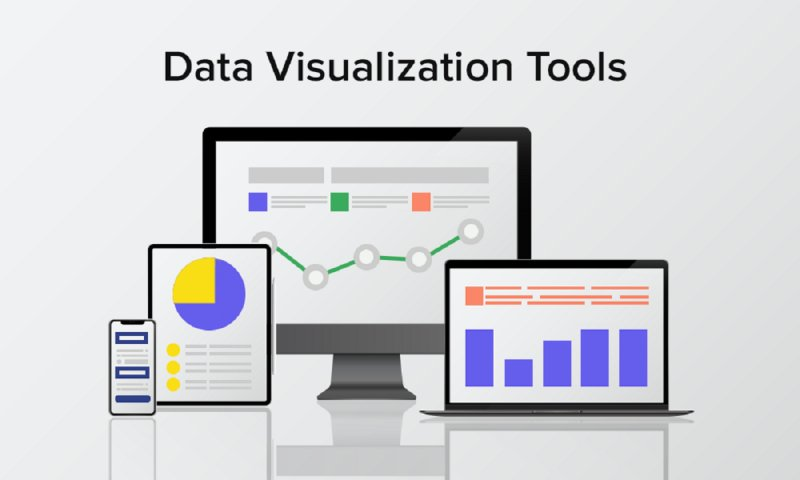
Data visualization tools are software applications or platforms that facilitate the creation, exploration, and presentation of graphic representations of data. These data visualization tools are specifically designed to simplify the process of transforming complex data into meaningful and informative visuals.
Some of the popular and best data visualization tools include Google Charts, Zoho Analytics, D3.js, and Microsoft Excel. Each data visualization tool has its strengths and caters to different user requirements.
Google Charts
The first data visualization tool, Google Charts, provides a wide range of charts, including bar graphs, line graphs, and scatter plots. It offers interactive features, customization options, and easy integration with web applications.
Zoho Analytics
Zoho Analytics is a comprehensive analytics platform that offers drag-and-drop functionality, pre-built visualizations, and advanced analytics capabilities. This data visualization tool allows users to create insightful reports and dashboards.
D3.js
D3.js is a powerful JavaScript library that provides extensive control over visualization creation. This data visualization tool enables users to build custom visualizations and supports advanced techniques such as data binding and animation.
Microsoft Excel
Microsoft Excel, the last data visualization tool in our list is a widely used spreadsheet application, that offers basic visualization capabilities. This data visualization tool allows users to create charts, pivot tables, and other graphic representations using a familiar interface.
Data Visualization Software
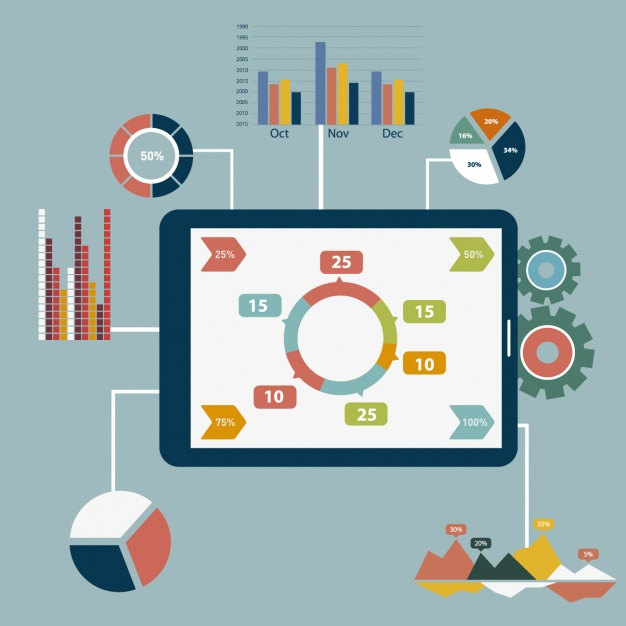
Data visualization software refers to specialized applications or tools that let users to create, manipulate, and present visual representations of data. These software solutions provide a user-friendly interface and a range of features designed to transform complex data into informative visual displays.
Data visualization software allows users to import data from various sources, such as databases, spreadsheets, or external files, and then apply different visualization techniques to represent the data in charts, graphs, maps, or other visual formats.
These tools often offer a wide selection of customizable templates, color schemes, and interactive elements to enhance the visual appeal and usability of the resulting visualizations.
Popular data visualization software options include Tableau, Power BI, QlikView, Google Data Studio, and many others. Each software has its own unique set of features and capabilities, catering to different user requirements and levels of expertise.
These tools have become invaluable for professionals across various industries, including business analysts, data scientists, marketers, and researchers, who seek to transform complex data into practical insights and effectively communicate their findings to stakeholders.

Conclusion
In conclusion, data visualization is a powerful approach to transforming complex data into actionable insights.
By employing effective techniques and utilizing data visualization tools, organizations can unlock the potential hidden in their data.
Whether in business intelligence, data analytics, scientific research, or other fields, visualizing data enables users to make data-driven decisions and communicate findings effectively.
As technology advances, data visualization will continue to evolve, providing new opportunities to extract valuable insights and drive innovation.
Embracing data visualization empowers organizations to navigate the data-driven landscape with confidence.

People Also Ask (FAQs)
What are data visualizations?
Data visualizations are graphic representations of complex data, such as charts, graphs, or maps, that make it easier to understand patterns, trends, and relationships within the data. They transform raw data into visually appealing and informative displays, enabling users to extract implementable insights more efficiently.
Why is data visualization important?
Data visualization is essential because it simplifies complex data and enhances understanding. By displaying data visually, it enables individuals to grasp the big picture, identify trends, outliers, and correlations, and make data-driven decisions. It also facilitates effective communication of insights to stakeholders, fostering collaboration and driving actionable outcomes.
What are data visualization tools and software?
Data visualization software and tools are applications or platforms designed to create, manipulate, and present graphic representations of data. These data visualization tools offer a range of features and capabilities, including drag-and-drop interfaces, pre-built templates, interactive elements, and integration with various data sources. Popular examples include Tableau, Power BI, and Google Data Studio.
What are interactive data visualizations?
Interactive data visualizations allow users to engage with the data actively. They provide interactive features such as tooltips, filters, drill-down capabilities, or animations that let users explore the data from different angles. Interactive visualizations empower users to manipulate and analyze the data, uncovering deeper insights and fostering a more immersive data exploration experience.
How can data visualization help in displaying data effectively?
Data visualization helps present data in a more engaging and digestible manner. Transforming raw data into graphic representations, it simplifies complex information and allows the audience to grasp key insights quickly. Visualizations enable presenters to tell compelling stories, highlight important trends, and emphasize key points, making data presentations more impactful and memorable.


